Allied health programs by state
3,572 allied health programs in 17 fields of allied health, with costs, results and funding that can make them free
1,570 schools offer these programs in all 50 states and 2 territories, and each state on this page approved its programs for workforce funding. Compare the 17 fields below, or pick a state on the map or in the table to see its programs side by side.
Allied health covers health jobs beyond doctors and nurses. Here that means dental assistants and hygienists, X-ray, MRI, cardiovascular, sleep, dialysis and surgical techs, opticians, physical and occupational therapy assistants, massage therapists and personal trainers, and for animals, vet techs and veterinary assistants. Some take a certificate of a few months; others take a two-year degree.
Compare allied health programs across the US: cost, pay and results

966 programs in all 50 states and 2 territories
- Most cost
- $2,995 to $9,444
- Earned a year, estimated
- about $27,700
- Working 6 months later
- 82%
- Finished
- 85%
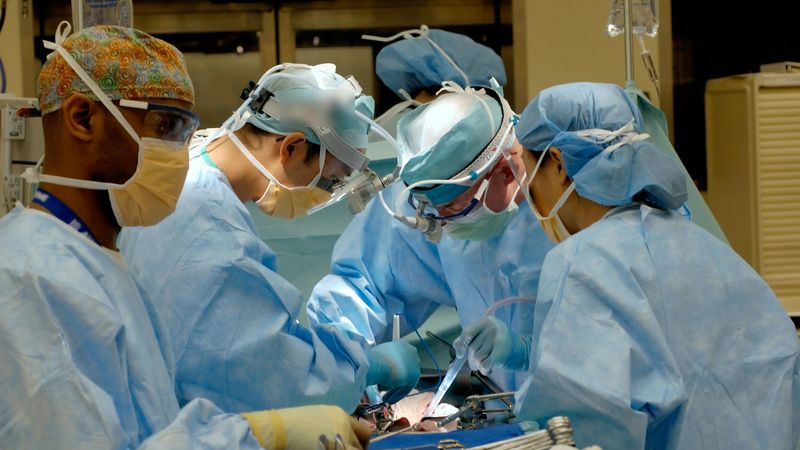
363 programs in 45 states
- Most cost
- $5,100 to $13,284
- Earned a year, estimated
- about $39,400
- Working 6 months later
- 86%
- Finished
- 69%
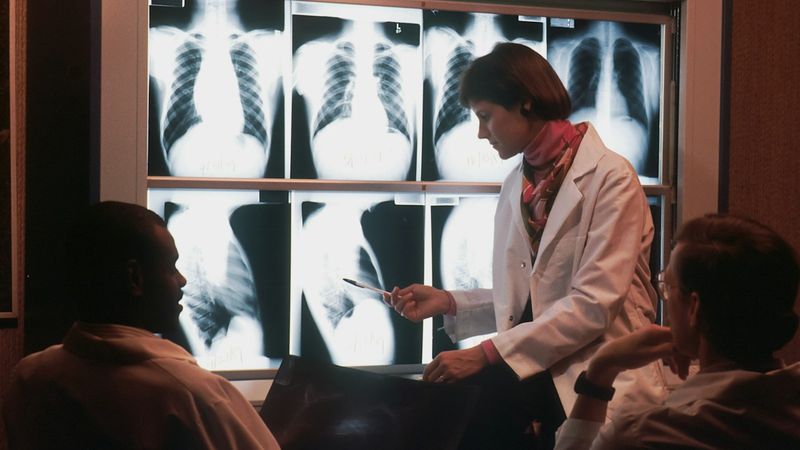
345 programs in 41 states and 1 territory
- Most cost
- $7,779 to $22,184
- Earned a year, estimated
- about $42,400
- Working 6 months later
- 85%
- Finished
- 71%

305 programs in 43 states and 2 territories
- Most cost
- $5,711 to $13,000
- Earned a year, estimated
- about $26,500
- Working 6 months later
- 68%
- Finished
- 83%

218 programs in 42 states and 1 territory
- Most cost
- $2,317 to $13,662
- Earned a year, estimated
- about $28,500
- Working 6 months later
- 74%
- Finished
- 65%
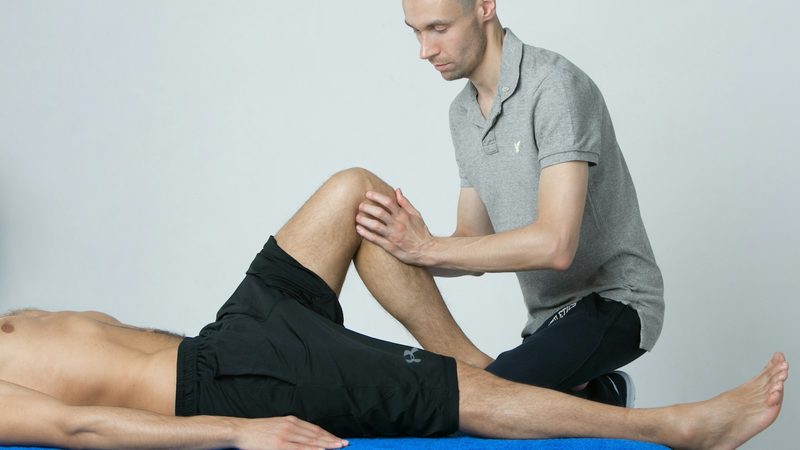
217 programs in 40 states
- Most cost
- $5,716 to $15,694
- Earned a year, estimated
- about $34,900
- Working 6 months later
- 80%
- Finished
- 69%

213 programs in 34 states and 1 territory
- Most cost
- $8,531 to $17,540
- Earned a year, estimated
- about $49,600
- Working 6 months later
- 84%
- Finished
- 71%
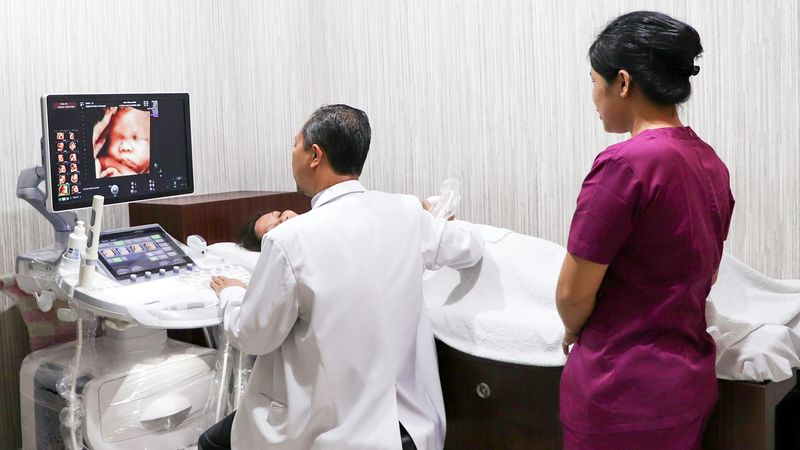
183 programs in 38 states and 1 territory
- Most cost
- $8,481 to $27,890
- Earned a year, estimated
- about $52,600
- Working 6 months later
- 79%
- Finished
- 80%

180 programs in 36 states and 1 territory
- Most cost
- $1,995 to $4,000
- Earned a year, estimated
- about $35,000
- Working 6 months later
- 78%
- Finished
- 75%

171 programs in 37 states
- Most cost
- $9,153 to $25,526
- Earned a year, estimated
- about $53,400
- Working 6 months later
- 83%
- Finished
- 73%

123 programs in 27 states and 1 territory
- Most cost
- $1,572 to $5,566
- Earned a year, estimated
- about $27,000
- Working 6 months later
- 69%
- Finished
- 42%

101 programs in 33 states and 1 territory
- Most cost
- $9,089 to $16,454
- Earned a year, estimated
- about $29,800
- Working 6 months later
- 78%
- Finished
- 73%
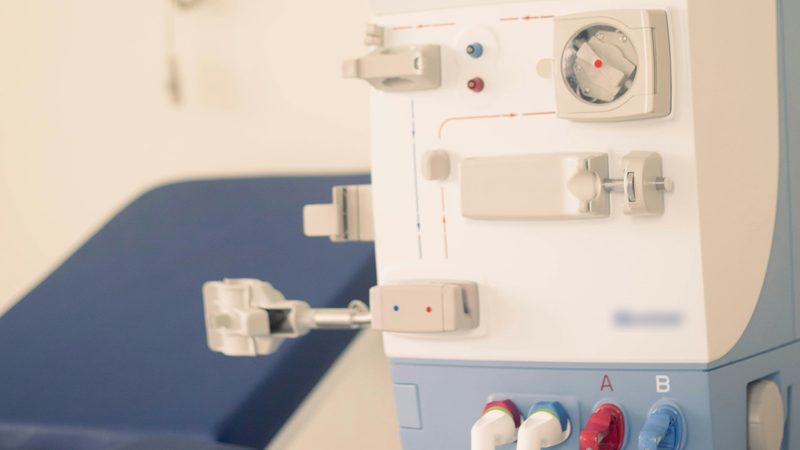
60 programs in 22 states
- Most cost
- $2,102 to $4,381
- Earned a year, estimated
- Not enough data
- Working 6 months later
- Not enough data
- Finished
- Not enough data
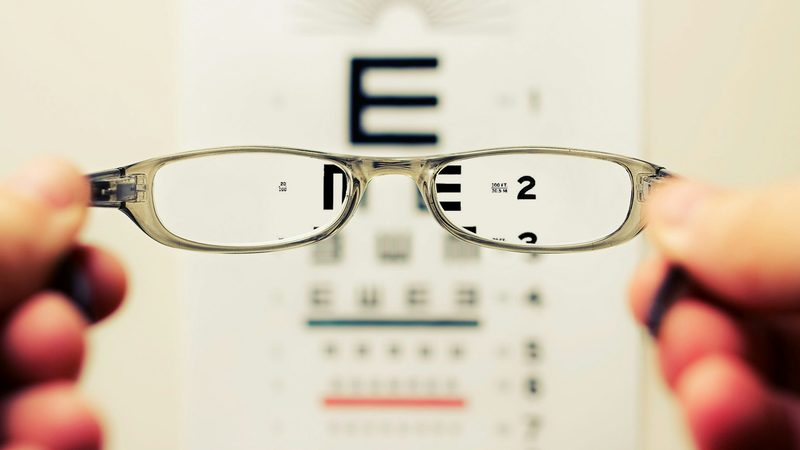
54 programs in 21 states and 1 territory
- Most cost
- $1,995 to $6,486
- Earned a year, estimated
- about $35,500
- Working 6 months later
- 75%
- Finished
- 75%
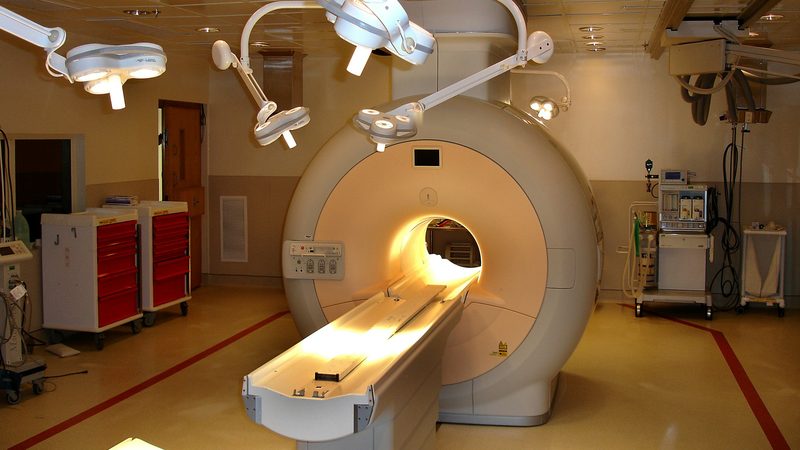
29 programs in 11 states
- Most cost
- $2,141 to $12,321
- Earned a year, estimated
- Not enough data
- Working 6 months later
- Not enough data
- Finished
- 71%
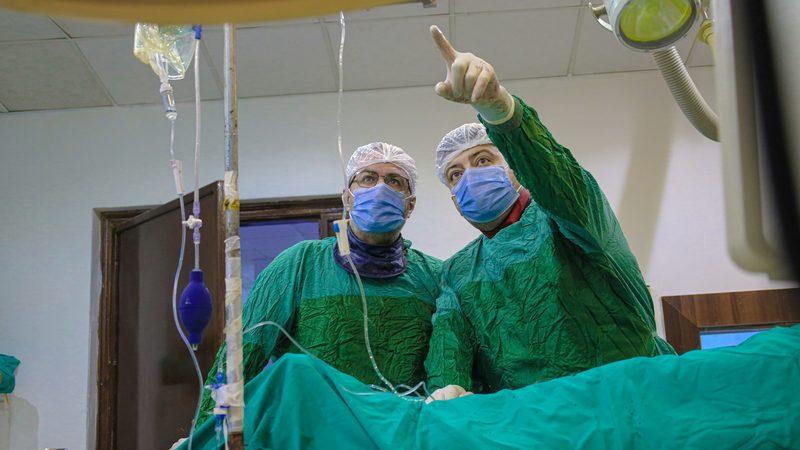
26 programs in 14 states and 1 territory
- Most cost
- $8,675 to $23,205
- Earned a year, estimated
- about $47,500
- Working 6 months later
- 74%
- Finished
- 58%

18 programs in 11 states
- Most cost
- $3,795 to $9,050
- Earned a year, estimated
- about $29,200
- Working 6 months later
- 77%
- Finished
- 68%


Each figure is the middle program of that field across the US. Yearly earnings are the reported quarter times four, an estimate. Source: US Department of Labor, program year 2024 (July 2024 to June 2025). Only programs approved for workforce funding are counted. How these figures are made
Allied health programs by state: cost, pay and results
| State | Programs | Most cost | Earned a year, estimated | Working 6 months later | Finished |
|---|---|---|---|---|---|
| Alabama | 44 | $3,706 to $11,996 | about $39,500 | Left out | 84% |
| Alaska | 13 | $15,551 to $18,000 | about $37,000 | 84% | 86% |
| Arizona | 81 | $6,351 to $18,705 | about $30,200 | 98% | 67% |
| Arkansas | 44 | $7,368 to $18,495 | about $32,400 | 67% | 69% |
| California | 186 | $2,700 to $15,000 | about $40,600 | 74% | 82% |
| Colorado | 67 | $4,000 to $11,388 | about $37,200 | 59% | 69% |
| Connecticut | 30 | $2,068 to $3,897 | about $31,700 | 80% | 91% |
| Delaware | 15 | $3,849 to $18,493 | Not enough data | Not enough data | 100% |
| Florida | 181 | $4,740 to $14,242 | about $36,500 | 83% | 78% |
| Georgia | 124 | $5,912 to $10,717 | about $30,100 | 79% | 48% |
| Hawaii | 12 | $3,750 to $6,982 | about $32,700 | 71% | 95% |
| Idaho | 7 | $9,295 to $21,897 | Not reported | Left out | 96% |
| Illinois | 173 | Left out | Not enough data | Not enough data | Left out |
| Indiana | 122 | $2,750 to $10,394 | about $27,500 | 78% | 77% |
| Iowa | 70 | $9,466 to $16,854 | about $34,500 | 88% | 65% |
| Kansas | 17 | $9,351 to $14,957 | Not enough data | Not enough data | 100% |
| Kentucky | 71 | $11,424 to $16,158 | about $21,200 | 69% | 67% |
| Louisiana | 85 | $3,299 to $14,030 | about $26,900 | Left out | Left out |
| Maine | 22 | $4,773 to $9,004 | about $39,700 | 85% | 80% |
| Maryland | 50 | $2,200 to $9,056 | about $34,300 | 79% | 78% |
| Massachusetts | 36 | $3,156 to $11,052 | Not enough data | Not enough data | Not enough data |
| Michigan | 183 | $6,162 to $18,710 | about $33,000 | 81% | 59% |
| Minnesota | 100 | $5,316 to $12,460 | about $28,800 | 73% | 52% |
| Mississippi | 48 | $6,175 to $10,196 | about $39,700 | 89% | Left out |
| Missouri | 135 | $4,000 to $21,973 | Not enough data | Not enough data | Not enough data |
| Montana | 18 | $5,302 to $15,465 | Not enough data | Not enough data | Not enough data |
| Nebraska | 40 | $4,000 to $9,360 | about $41,300 | 87% | 83% |
| Nevada | 55 | $2,320 to $7,508 | Not enough data | Left out | 73% |
| New Hampshire | 32 | $404 to $7,000 | about $33,100 | Left out | 93% |
| New Jersey | 21 | $3,000 to $9,500 | Not enough data | Not enough data | Not enough data |
| New Mexico | 51 | $3,965 to $10,882 | about $35,500 | 55% | Left out |
| New York | 18 | $6,383 to $16,262 | Not reported | Not reported | Not reported |
| North Carolina | 179 | $1,385 to $5,804 | about $35,700 | 80% | 57% |
| North Dakota | 12 | $14,750 to $31,446 | Not enough data | Not enough data | Not enough data |
| Ohio | 276 | $4,139 to $14,153 | about $40,200 | 84% | 74% |
| Oklahoma | 51 | $4,530 to $13,429 | about $43,800 | Left out | 90% |
| Oregon | 17 | $8,464 to $14,363 | Not enough data | Not enough data | Not enough data |
| Pennsylvania | 49 | $3,986 to $21,724 | Not enough data | Left out | 92% |
| Puerto Rico | 32 | $12,327 to $23,205 | about $14,000 | Left out | Left out |
| Rhode Island | 2 | Too few figures to show | |||
| South Carolina | 15 | $2,122 to $7,160 | about $29,700 | 75% | 88% |
| South Dakota | 12 | $15,958 to $22,504 | about $34,400 | Left out | 73% |
| Tennessee | 109 | $4,149 to $14,568 | about $35,500 | 88% | 78% |
| Texas | 228 | $3,904 to $10,137 | about $33,900 | 82% | 86% |
| US Virgin Islands | 4 | Too few figures to show | |||
| Utah | 39 | $3,262 to $16,600 | about $30,800 | Left out | 84% |
| Vermont | 8 | $4,000 to $5,763 | about $35,300 | 67% | 78% |
| Virginia | 69 | $1,699 to $11,286 | Not enough data | Not enough data | 99% |
| Washington | 191 | $4,221 to $13,841 | about $36,100 | 83% | 86% |
| West Virginia | 11 | $8,882 to $21,170 | about $48,700 | Left out | 90% |
| Wisconsin | 92 | $5,025 to $10,957 | about $32,300 | 80% | 45% |
| Wyoming | 25 | $2,850 to $9,724 | Not enough data | Left out | 90% |
Each figure is the middle program in that state, all allied health fields together. Open a state to compare its fields.
Other job training by line of work
- Trade school programs13,156
- IT certification programs7,854
- Business and office training7,270
- Medical certification programs7,167
- Nursing and patient care programs4,782
- Transportation and logistics training3,558
- First responder training2,561
- Child care and social services training1,952
- Beauty school1,043
- Culinary and hospitality programs900
Programs approved across the US in each line of work.
Where the allied health numbers come from
Which programs are counted?
Programs approved for WIOA funding (public workforce funding under the Workforce Innovation and Opportunity Act) in the fields listed above. Each state keeps its approved programs on an eligible training provider list (ETPL).5 They come from the US Department of Labor's file for program year 2024 (July 2024 to June 2025), covering programs approved as of June 30, 2025. Schools that never applied for approval are missing.
What the figures mean
Each figure is the middle program among those that report it: half did better, half did worse. Prices are what most programs cost if you pay yourself (the middle half). Earnings are for the second quarter after students left, times four. Where a figure is missing, it says why: "Not reported", "Left out" or "Not enough data" (what each means). Some states' figures carry a note on their own pages.
Sources for the funding facts about allied health programs
Show the 5 sourcesHide the sources
- US Department of Labor, TrainingProviderResults.gov: About This Site
- US Department of Labor: WIOA Adult Program
- Code of Federal Regulations, title 20, part 680, sections 680.220, 680.230 and 680.310: career services before training, other grants such as Pell Grants first, and limits on Individual Training Accounts (GovInfo, 2024 edition)
- US Department of Labor: American Job Centers
- US Department of Labor, Training and Employment Guidance Letter 8-19, Attachment I: Requirements for Training Providers, Program Eligibility, and the State Eligible Training Provider (ETP) List